ONE HEALTH QUANTITATIVE METHODS
2.12
Exercising with numbers: solutions
Here you find the solution to the exercise of the previous step. If desired, you may download a completed spreadsheet.
The formulas should be:
$$S_{(T+1)}$$= B2 + ($F$2 * (B2+C2+D2)) - ($E$2 * B2 * C2) - ($F$2 * B2)
$$I_{(T+1)}$$= C2 + ($E$2 * B2 * C2) - ($F$2 * C2) - ($G$2 * C2)
$$R_{(T+1)}$$ = D2 + ($G$2 * C2) - ($F$2 * D2)
The graph should look like this:
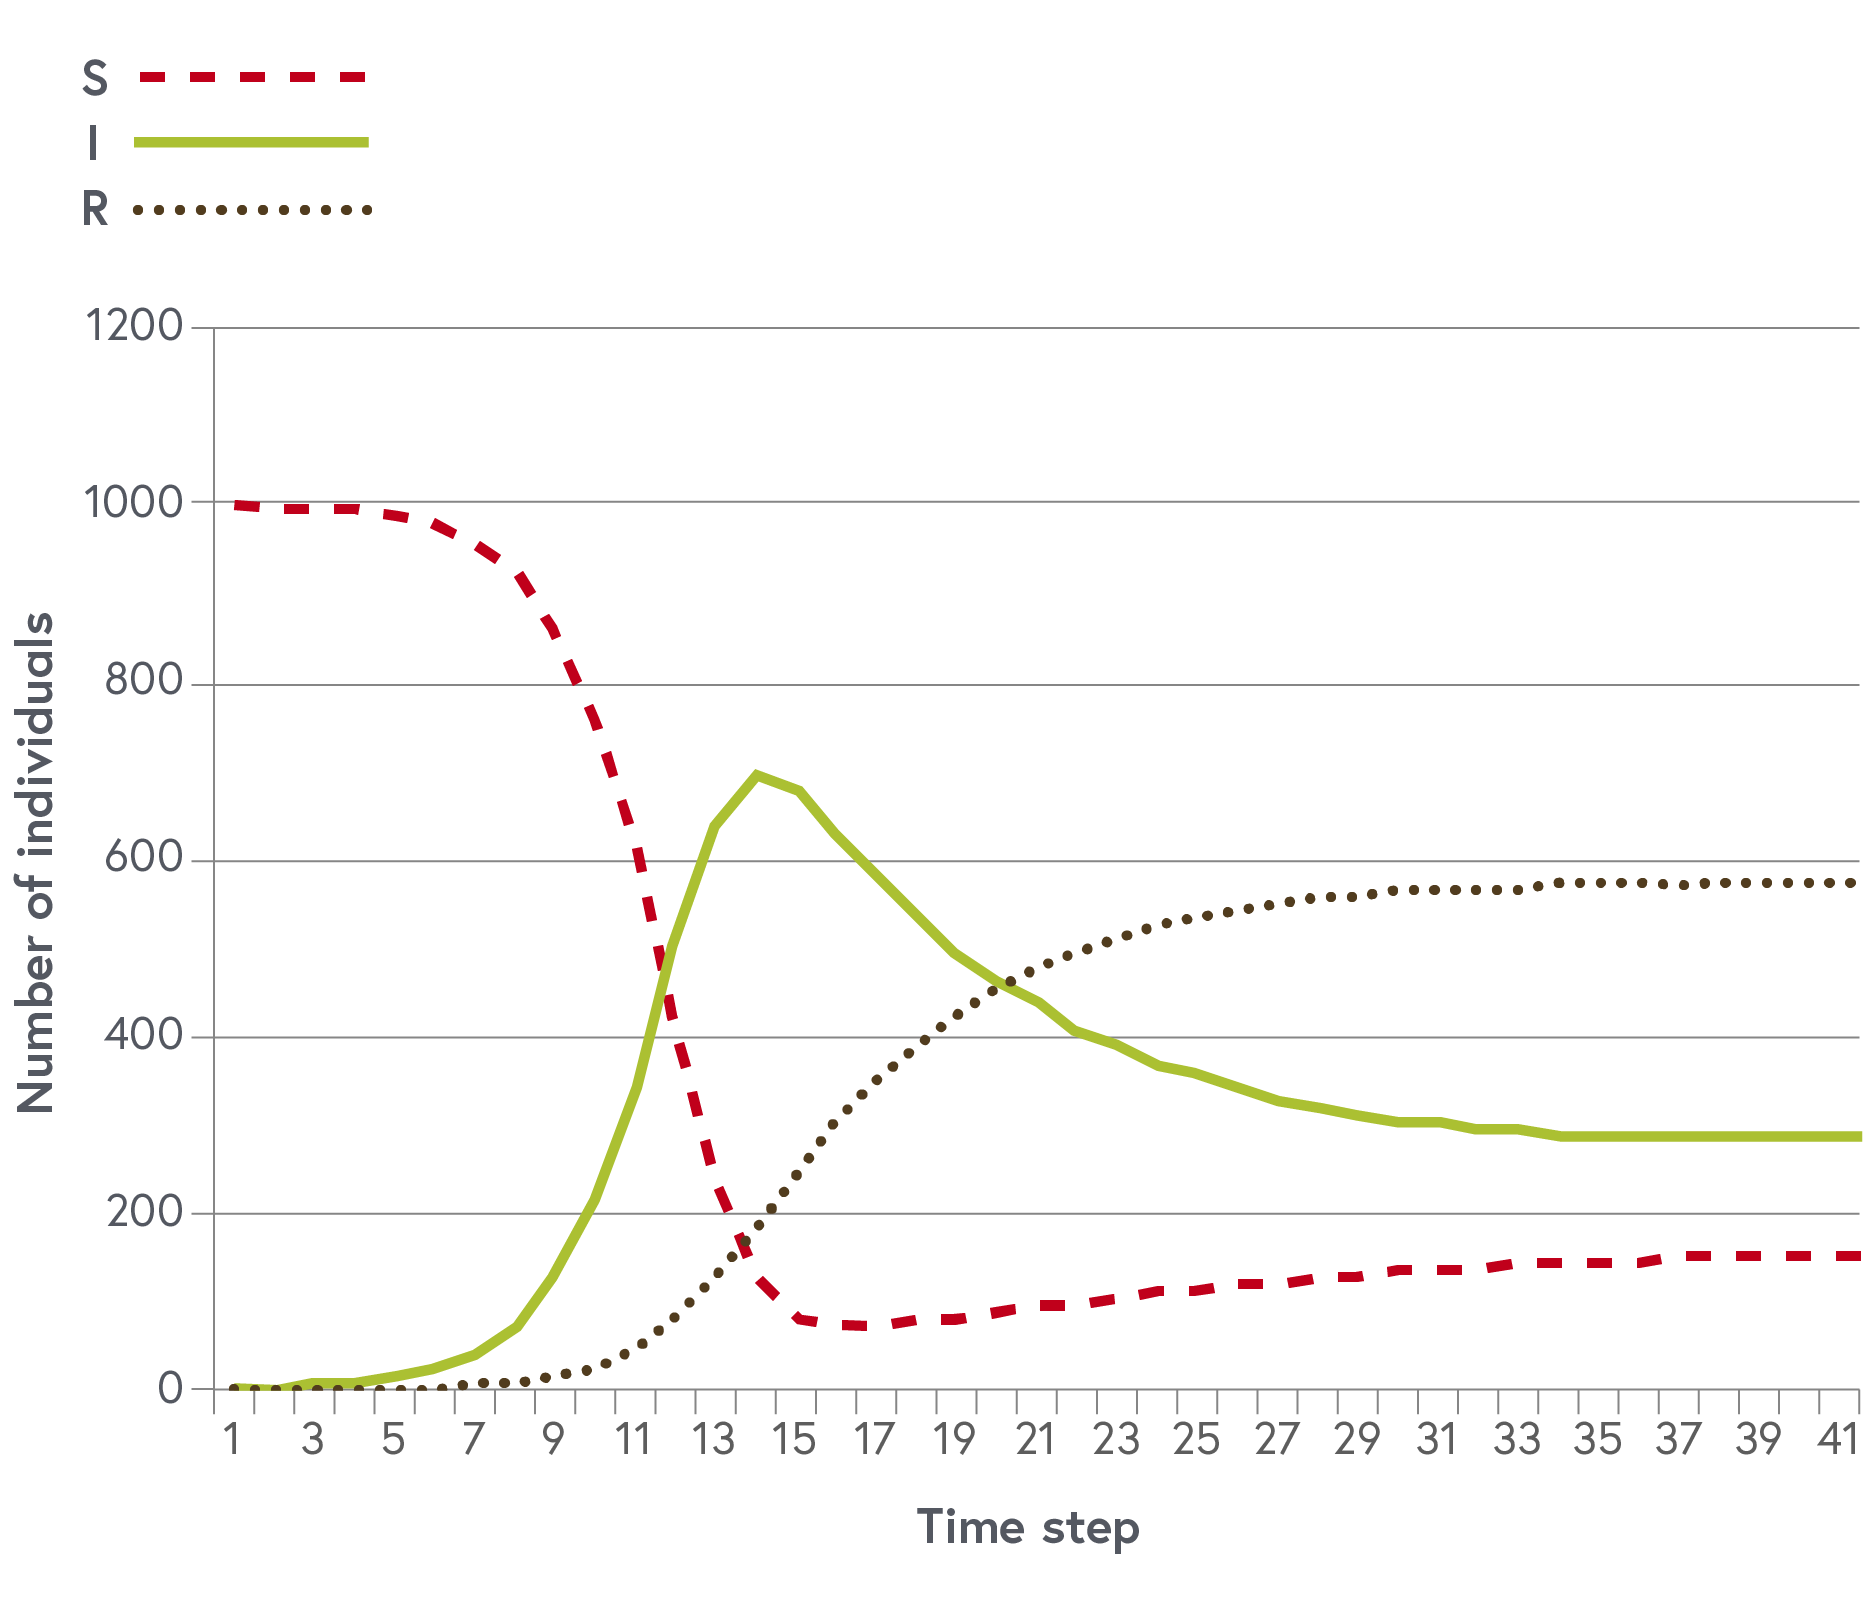 Time dependent changes in the numbers of susceptible, infectious and recovered individuals.
© Jakob Zinsstag
Answer on the dynamics:
We observe an initial epidemic peak and then an on-going low level of transmission.
Answer on shortfalls:
The formula works with non-integer numbers. In principle, there should only be integers if we assume individuals. This problem can be overcome if we assume that we deal with large numbers, for example, a million people instead of one thousand. The model uses discrete time steps, which is a good approximation if the time steps are short (like days) but performs poorly if the time steps represent years.
License
University of Basel
Downloads
- Hide »
- Toggle Theme
-
History
/en/one-health-connecter-les-humains-les-animaux-et-lenvironnement-13/one-health-quantitative-methods-59/s-entrainer-avec-des-chiffres-solutions-411 -
Versions
Django 5.2.9 -
Time
CPU: 200.16ms (204.85ms) - Settings
- Headers
-
Request
apply_cache -
SQL
0 queries in 0.00ms -
Static files
7 files used -
Templates
step/step_home.html -
Cache
40 calls in 20.59ms -
Cachalot
Last invalidation: 55 minutes -
Signals
145 receivers of 15 signals -
Intercept redirects
-
Profiling